

4 Web Performance Essentials for Software Engineering Teams
Is your web app fast enough?


In this mobile-first world, every application out there is competing for the attention span of its users.
If your company wants to run a successful online business, it is important that your site engages the users quickly even in bandwidth and/or CPU-constrained environments.
For most online businesses, poor web performance has been the leading reason forcing them to lose potential customers.
In fact, according to a survey conducted by Akamai, as many as 50% of all mobile visitors expect a site to load within 2 seconds on a 3G network. That is almost half of your mobile visitors walking away if you fail to meet their expectations.
There is a common misconception among teams that web performance only matters for e-commerce applications. Any customer-facing web application should make performance a requirement than a feature ( especially now that Google’s ranking algorithm takes your website’s performance into account ). I personally believe :
Performance is primarily about user experience. It provides a way for the engineering team to convey that they care about their customers productivity and experience.
Good performance is rarely a side effect of teams writing good code. It almost always requires teams to spend dedicated effort to measure and improve metrics that matter.
Good teams should objectively measure critical metrics and should have insights into the impact of performance on their user engagement.
Based on my experience working with and guiding various teams, I will use this blog post to share:
How to think about and classify web performance
Core metrics to track and measure
Best practices to consider for improving core metrics
Process for building a performance-based culture in engineering teams
Classifying Web Performance
Performance can be broadly classified into 3 categories :
Load Performance: How fast can the client receive the resources required for your website
Parse Performance: How fast can the browser parse the received resources, construct object models, and in turn a render tree.
Render Performance: How well can the browser render the constructed render tree. How frequently does the layout re-flow and how frequently does the browser repaint?

Each of these 3 performance aspects is important for how the end-user perceives the performance of your web application.
The user might have received all the resources from the nearby CDN very fast, but if it takes time for the browser to parse the received resources the user experience will suffer.
Similarly, if the browser can parse the resources very quickly but is not able to render the content properly within 60 fps and has to consistently re-flow the layout then also the user experience will suffer.
Identifying Key Web Performance Metrics
Improving performance starts with identifying metrics that your team cares about. These metrics may vary depending on your business need. In an initiative to standardize the performance metrics, Google published Web Vitals. Web Vitals are a set of metrics based on the RAIL performance modelthat provides unified guidance for creating great user experiences on the web.
Core Web Vitals are a subset of Web Vital metrics that apply to all web pages, these should be measured by all site owners as they represent distinct facets of how a user experiences your web app and are used in the search ranking algorithm.
Largest Contentful Paint (LCP)
This reports the time it took to render the largest image or text block element on the user’s viewport. I generally think of it as the time it takes for the user to see more than half of their viewport.

Measures the Load Performance of your site.
For a good user experience, LCP should happen in 2.5 seconds

Best Practices:
Preload the critical resources using
preloadandpreconnectattributes. Leverage HTTP/2 server push if applicable.
<link rel="preload" as="style" href="css/style.css">Use a service worker and/or a CDN to cache the assets and replace any new available versions in the background. This eliminates any first-time load delays for the user.
Avoid using CommonJS modules in your code. Remove dependency on any external libraries that use CommonJS modules.
Use bundlers like Webpack to tree shake dead code and split resources into chunks that can be loaded on demand.
Minify and Compress resources, bundlers like Webpack can help here too.
Lazy or Defer load non critical but dependent resources. For images use the LazySizes Library
/* Defers download and execution till the entire DOM is rendered */
<script src="defer.js" defer></script>/* Downloads after all the initial resources are downloaded, starts immediate execution */<script src="async.js" async></script>
First Input Delay (FID)
Reports the time the web application takes to respond to first user interaction (this could be clicking on a button/link or entering text into an input field). This is the user’s first impression of your site.
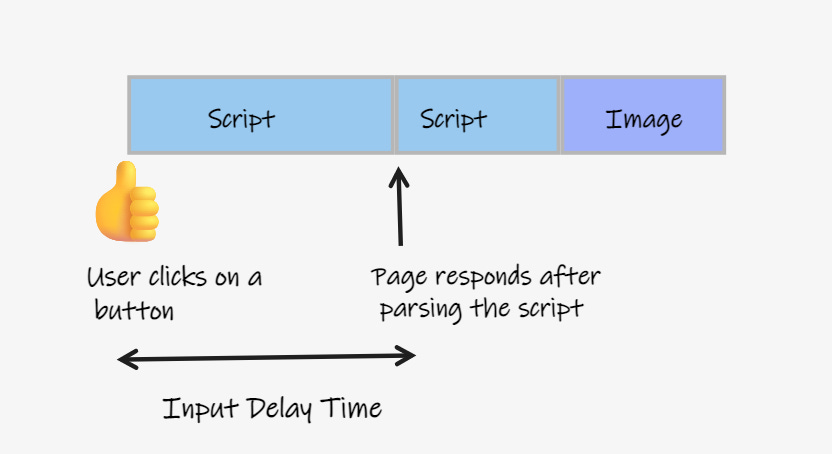
Measures the delay in event processing, as the Browser’s main thread is busy doing other operations like parsing a huge JavaScript file.
For a good user experience, FID should be less than 100 ms

Best Practices:
The browser’s main thread is blocked when parsing and compiling JavaScript/CSS received from the network. In order to reduce this blocked time, split the resources into < 300 KB chunks and lazy load them on demand. As discussed above (in the RAIL Performance Model), it is a good practice to ensure the browser has more than 50 ms to respond to user input in a 100 ms time span.
The browser’s main thread is also blocked when executing the JavaScript. Again, the first step here is to make sure the browser does minimal work by serving it chunks of resources to process. Ensure your JavaScript code doesn’t hold onto lot of references in memory. Memory leaks can cause your page to freeze completely.
If your app has a dependency on 3rd party JavaScript or CSS, preconnect and preload or defer load them based on the critical nature of these resources.
Audit JavaScript execution time and memory usage using browser developer tools like Lighthouse.
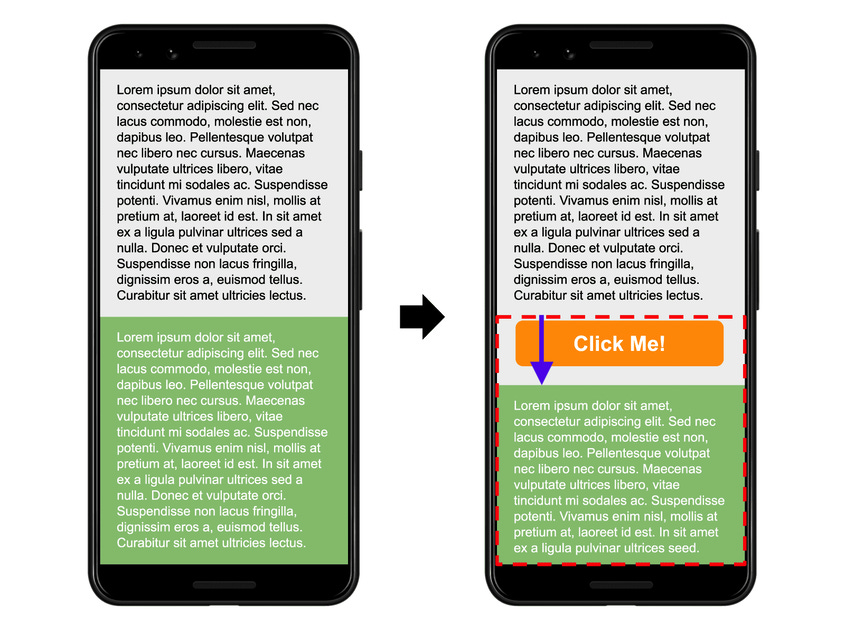
Cumulative Layout Shift (CLS)
To understand CLS better, let’s define a few terms:
Layout Shift: A layout shift occurs anytime a visible element changes its position from one rendered from to the next.
Unexpected Layout Shift: Not all layout shifts are bad, some of the layout shifts are needed (for example: Showing a loading spinner or opening a pane in response to a user action). Layout Shift is bad if the user isn’t expecting it. Any time content moves abruptly and unexpectedly especially after 500 ms of a recent user input is considered bad.
Session Window: This is a measuring window that starts with first layout shift and continues to expand until there is a gap of at least 1 second with no layout shifts.
CLS reports the largest score of unexpected layout shifts across all session windows in a 5 second period, where each session window should have at least a 1-second gap.
Measures the visual stability of your web application
It helps quantify how often users experience unexpected layout shifts, a low CLS score of 0.2 and below the ensures the experience is delightful.
Best Practices:
Use responsive images with srcset attribute, if not include size attributes on image and video elements or use unsized-media attribute
Preload the font and cache it in the browser, use font-display:optional so that if it’s slow on the initial load we directly render the fallback font.
Statically reserve space for content that gets dynamically added or resized and load the content in that space.
Avoid Table-based layouts
Never insert content above existing content, except in response to user interaction
Always prefer ‘transform’ animations to property animations (as they trigger layout changes)
Measuring Web Vitals
Most of the modern browsers have included measurement of these aspects like load time, time to interact, animation frames in their developer tools.
Chromium-based browsers include Lighthouse, which audits the performance of your web page under various constraints and provides information on improvements that can be performed on your site.

If you are using a Chromium-based Browser (Chrome/Edge), just open up your browser developer tools -> Lighthouse Tab -> Click Generate Report
Below you can see a sample run of Web Vital measurements using Lighthouse (in Microsoft Edge Developer Tools) for a Progressive Web App
If you are using other browsers:
Go to the page speed insights portal and enter your site URL.
Firefox has a Lighthouse extension that you can install
If you want to include metric measurement in your CI pipeline:
You can run a stand-alone instance of Lighthouse
Process for Establishing Performance Budgets
Performance for your web application is not a feature but a requirement. Just like any other functional requirement, establishing performance budgets in OKRs, measuring them, and tracking them is critical for introducing performance-based culture in Engineering teams.
A few examples of quantifiable performance budgets that can be tracked as part of OKRs are:
Ensuring critical path chunk sizes are less than 200 KB of JavaScript
Lighthouse performance audit score should be greater than 90
Home page must load in < 3 secs
Page should load useful data and respond to user interaction within 50 ms
Time to first byte (TTFB) should be less than 500 ms.
Here are some of the best practices that teams have adopted to achieve these goals:
Establish a process for investigating regressions early on and identifying anti-patterns that hurt performance. Implementing static code analysis to eliminate these anti patterns.
Enforcing performance budgets in CI pipelines, anytime a pull request violates these constraints it will be sent back for fixes.
Invest in setting up performance labs that simulate environments with real-world constraints. They help developers test and fix issues that are hard to reproduce in dev boxes.
Use CDN for serving assets that don’t change frequently, deploy servers in regions close to the high percentage of customers
Adopt a controlled rolling upgrade strategy that deploys any new changes to regions with low traffic, monitors performance metrics, and continues deploying to the next region only if they meet set budgets.
Setting up synthetic monitors and alerting on any metric violations in production.
The ability to iterate on performance is what separates the best teams from the rest.
As the saying goes, “You don’t have to be outstanding at everything, but you have to be good at the things that are essential.”
If your team is not building their performance muscle with regular iterations, then you are likely losing out on opportunities that performance delivers for your business right now, and long term.
I hope the process and the learnings shared in this post will act as a solid foundation for your team to start on this Web Performance journey.